By Sharma Research
Concept inspired by John Carter (TTM Squeeze)
TTM Squeeze Advance is an advanced volatility–momentum indicator designed to identify one of the most important structural market phases:
Periods of low volatility that often precede expansion.
Markets do not move randomly.
They alternate between:
-
Compression (quiet accumulation)
-
Expansion (directional breakout)
-
Exhaustion (cooling off)
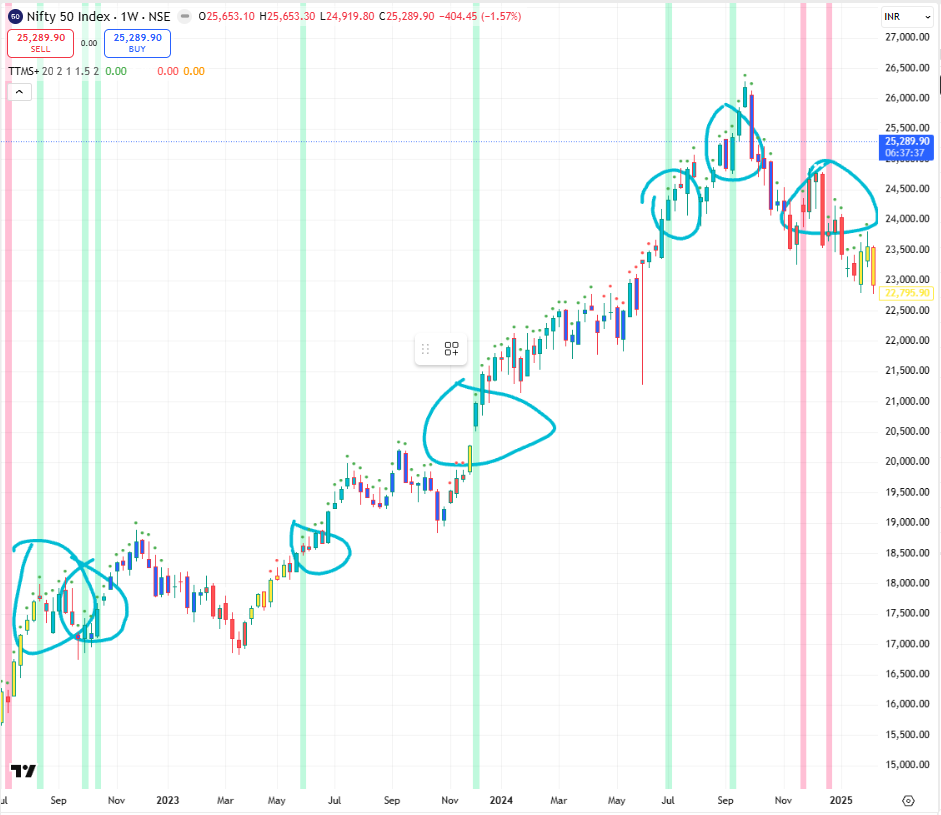
The TTM Squeeze framework is built to detect the first phase—when price becomes unusually “tight”—and prepare traders to observe what may come next.
🔍 Why Volatility Compression Matters
Most traders focus on movement.
But professional market behavior often begins with stillness.
Before strong directional moves, markets frequently enter zones where:
-
volatility contracts
-
ranges tighten
-
price becomes “coiled”
This is not a signal by itself.
It is a condition.
TTM Squeeze is essentially a tool that asks:
“Is the market currently in a compressed state where expansion becomes statistically more likely?”
⚙️ Core Logic: Bollinger Bands vs Keltner Channels
TTM Squeeze is based on the interaction between two volatility envelopes:
1️⃣ Bollinger Bands (Standard Deviation Expansion)
Bollinger Bands widen when volatility rises and contract when volatility falls.
They represent statistical volatility.
2️⃣ Keltner Channels (ATR-Based Volatility Range)
Keltner Channels are built using True Range smoothing.
They represent range volatility.
The Squeeze Condition
A squeeze occurs when Bollinger Bands contract inside the Keltner Channel.
That indicates:
-
volatility is unusually low
-
price movement is being compressed
-
the market is “loading energy”
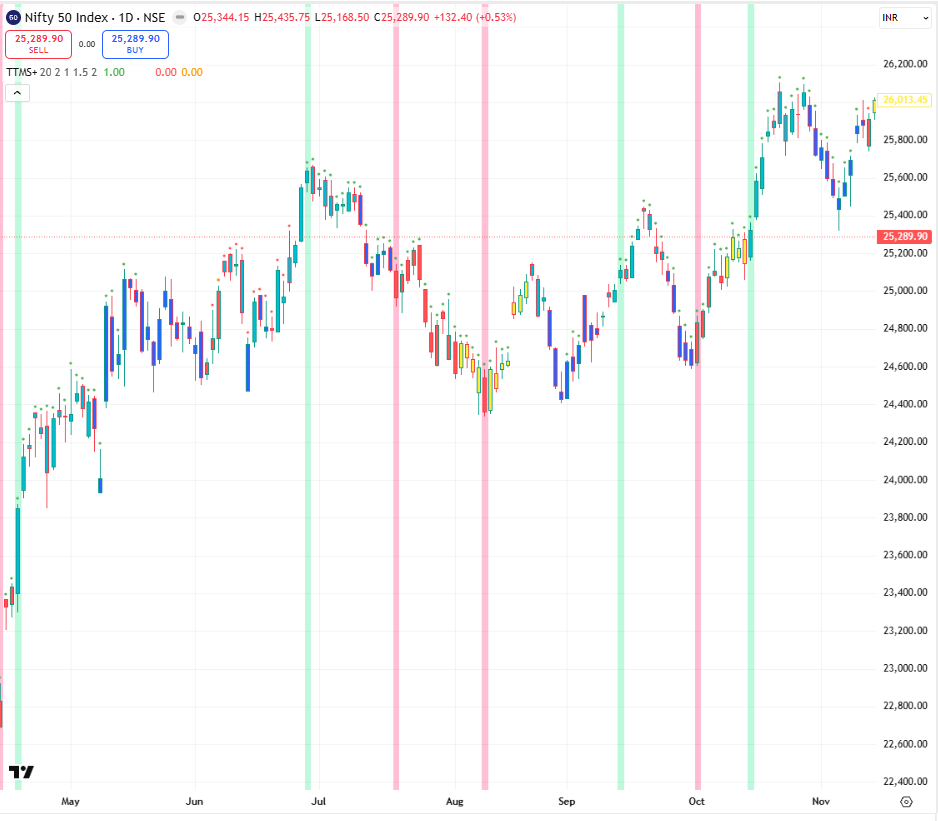
TTM Squeeze Advance plots multiple compression levels:
-
🟠 High Compression
-
🔴 Medium Compression
-
⚪ Low Compression
-
🟢 No Squeeze (Expansion Zone)
🟢 Understanding the Dot States
This indicator visualizes volatility regimes using squeeze dots:
-
Orange Dot → Very tight compression
-
Red Dot → Moderate compression
-
White Dot → Mild compression
-
Green Dot → No squeeze (volatility released)
A key interpretation:
Compression is preparation.
Green dots represent the environment where movement is already expanding.
🧠 Directional Bias: Momentum Oscillator Layer
TTM Squeeze by itself only tells you:
-
volatility is compressed
It does not tell you:
-
which direction the breakout may favor
That is why TTM Squeeze Advance includes a custom momentum oscillator, built using linear regression of price deviation from its midpoint.
This oscillator provides directional context:
-
Momentum above zero → bullish pressure
-
Momentum below zero → bearish pressure
-
Rising momentum → strengthening bias
-
Falling momentum → weakening bias
🎨 Momentum-Based Candle Coloring
To improve visual interpretation, the script colors candles based on momentum regime:
-
Aqua → bullish momentum strengthening
-
Blue → bullish momentum weakening
-
Red → bearish momentum strengthening
-
Yellow → bearish momentum weakening
This helps users see momentum shifts without needing extra oscillators.
✅ Entry Filtering: “Only Enter on Green Dots”
A major enhancement in this version is optional filtering:
Signals can be restricted to only occur during No Squeeze (Green Dot) states.
This aligns with a key principle:
-
Compression is the setup
-
Expansion is the action
So instead of firing entries inside tight ranges, the indicator can wait until volatility has actually begun releasing.
🔁 Cross Confirmation + Regime Change Logic
TTM Squeeze Advance includes optional cross-confirmation logic:
-
Signals trigger only when conditions newly appear
-
Prevents repeated firing inside the same regime
-
Encourages cleaner “state transition” interpretation
This makes the tool more suitable for structured backtesting and reduces clutter.
🔄 Inversion Option (Research Utility)
The indicator also supports an “Inverse” mode, which flips directional logic.
This is not meant as a recommendation, but as a research feature for exploring:
-
mean-reversion interpretations
-
alternative regime models
-
countertrend frameworks
🚨 Educational Use Only
TTM Squeeze Advance is designed for:
-
volatility regime study
-
momentum behavior analysis
-
backtesting expansion conditions
It is not a buy/sell recommendation system.
Volatility compression increases the probability of movement, not certainty of direction.
Proper risk management and contextual analysis remain essential.
📚 Concept Inspiration
The original TTM Squeeze framework is credited to:
-
John Carter (TTM Squeeze methodology)
-
Community implementations such as Beardy_Fred
TTM Squeeze Advance builds upon this classic by adding:
-
multi-level squeeze state dots
-
momentum-driven candle bias
-
optional expansion-only filtering
-
cross-confirmed regime transitions
-
background highlighting for clarity
👨💻 Developed By
Sharma Research
Written in Pine Script v5 for TradingView
Released for educational and research purposes only
//@version=5
// TTM Squeeze Advance by SharmaResearch.com
// Original concept credits: Beardy_Fred, John Carter (TTM Squeeze)
//
// How this works (quick intro):
// This indicator is an advanced implementation of the classic TTM Squeeze,
// combining Bollinger Bands and Keltner Channels to detect volatility compression zones.
// A custom momentum oscillator is used to determine directional bias and histogram coloring.
// Optional features include cross confirmation, signal inversion, and filtering entries
// to only occur during “No Squeeze” (green dot) states.
// Visual elements include squeeze dot states, momentum-based bar coloring,
// and background highlighting for confirmed directional conditions.
indicator("TTM Squeeze Advance by SharmaResearch.com (Concept: John Carter)", shorttitle="TTMS+", overlay=true)
// ──────────────────────────────────────────────
// Inputs
// ──────────────────────────────────────────────
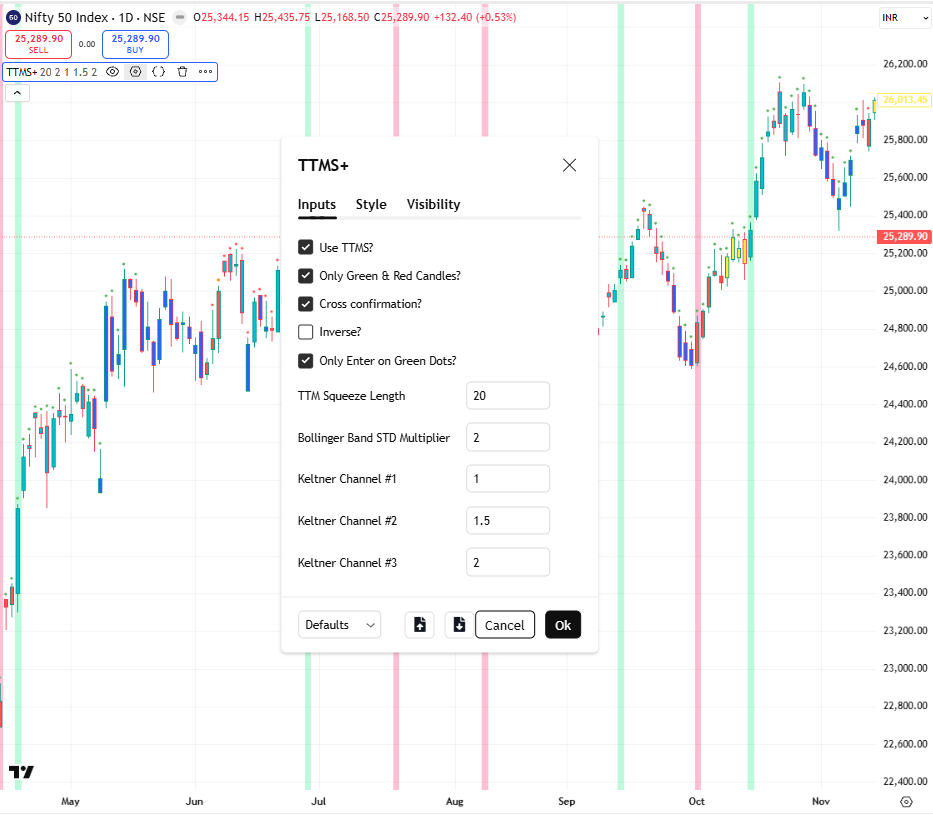
use_TTMS = input.bool(true, "Use TTMS?")
redGreen_TTMS = input.bool(true, "Only Green & Red Candles?")
cross_TTMS = input.bool(true, "Cross confirmation?")
inverse_TTMS = input.bool(false, "Inverse?")
highlightMovements_TTMS = input.bool(true, "Only Enter on Green Dots?")
length_TTMS = input.int(20, "TTM Squeeze Length")
// ──────────────────────────────────────────────
// Bollinger Bands
// ──────────────────────────────────────────────
BB_mult_TTMS = input.float(2.0, "Bollinger Band STD Multiplier")
BB_basis_TTMS = ta.sma(close, length_TTMS)
dev_TTMS = BB_mult_TTMS * ta.stdev(close, length_TTMS)
BB_upper_TTMS = BB_basis_TTMS + dev_TTMS
BB_lower_TTMS = BB_basis_TTMS - dev_TTMS
// ──────────────────────────────────────────────
// Keltner Channels
// ──────────────────────────────────────────────
KC_mult_high_TTMS = input.float(1.0, "Keltner Channel #1")
KC_mult_mid_TTMS = input.float(1.5, "Keltner Channel #2")
KC_mult_low_TTMS = input.float(2.0, "Keltner Channel #3")
KC_basis_TTMS = ta.sma(close, length_TTMS)
devKC_TTMS = ta.sma(ta.tr, length_TTMS)
KC_upper_high_TTMS = KC_basis_TTMS + devKC_TTMS * KC_mult_high_TTMS
KC_lower_high_TTMS = KC_basis_TTMS - devKC_TTMS * KC_mult_high_TTMS
KC_upper_mid_TTMS = KC_basis_TTMS + devKC_TTMS * KC_mult_mid_TTMS
KC_lower_mid_TTMS = KC_basis_TTMS - devKC_TTMS * KC_mult_mid_TTMS
KC_upper_low_TTMS = KC_basis_TTMS + devKC_TTMS * KC_mult_low_TTMS
KC_lower_low_TTMS = KC_basis_TTMS - devKC_TTMS * KC_mult_low_TTMS
// ──────────────────────────────────────────────
// Momentum Oscillator
// ──────────────────────────────────────────────
mid = math.avg(math.avg(ta.highest(high, length_TTMS), ta.lowest(low, length_TTMS)), ta.sma(close, length_TTMS))
mom_TTMS = ta.linreg(close - mid, length_TTMS, 0)
momentumUp = mom_TTMS > nz(mom_TTMS[1])
momentumDown = mom_TTMS < nz(mom_TTMS[1])
barColorUp = color.new(color.aqua, 0)
barColorDown = color.new(#2962ff, 0)
barColorNegUp = color.new(color.red, 0)
barColorNegDown = color.new(color.yellow, 0)
momColor = mom_TTMS > 0 ? (momentumUp ? barColorUp : barColorDown) : (momentumDown ? barColorNegUp : barColorNegDown)
barcolor(momColor)
// ──────────────────────────────────────────────
// Squeeze Conditions
// ──────────────────────────────────────────────
NoSqz_TTMS = BB_lower_TTMS < KC_lower_low_TTMS or BB_upper_TTMS > KC_upper_low_TTMS
LowSqz_TTMS = BB_lower_TTMS >= KC_lower_low_TTMS or BB_upper_TTMS <= KC_upper_low_TTMS
MidSqz_TTMS = BB_lower_TTMS >= KC_lower_mid_TTMS or BB_upper_TTMS <= KC_upper_mid_TTMS
HighSqz_TTMS = BB_lower_TTMS >= KC_lower_high_TTMS or BB_upper_TTMS <= KC_upper_high_TTMS
plotchar(NoSqz_TTMS, char='●', color=color.green, title="No Squeeze (Green)")
plotchar(LowSqz_TTMS, char='●', color=color.white, title="Low Compression (White)")
plotchar(MidSqz_TTMS, char='●', color=color.red, title="Mid Compression (Red)")
plotchar(HighSqz_TTMS, char='●', color=color.orange, title="High Compression (Orange)")
// ──────────────────────────────────────────────
// Signal Logic
// ──────────────────────────────────────────────
TTMS_Signals_TTMS = mom_TTMS > 0 ? (momentumUp ? 1 : 2) : (momentumDown ? -1 : -2)
basicLongCondition = redGreen_TTMS ? TTMS_Signals_TTMS == 1 : TTMS_Signals_TTMS > 0
basicShortCondition = redGreen_TTMS ? TTMS_Signals_TTMS == -1 : TTMS_Signals_TTMS < 0
entryLong = highlightMovements_TTMS ? NoSqz_TTMS and basicLongCondition : basicLongCondition
entryShort = highlightMovements_TTMS ? NoSqz_TTMS and basicShortCondition : basicShortCondition
entryLongFinal = cross_TTMS ? not entryLong[1] and entryLong : entryLong
entryShortFinal = cross_TTMS ? not entryShort[1] and entryShort : entryShort
TTMS_SignalsLongFinal = use_TTMS ? (inverse_TTMS ? entryShortFinal : entryLongFinal) : true
TTMS_SignalsShortFinal = use_TTMS ? (inverse_TTMS ? entryLongFinal : entryShortFinal) : true
// ──────────────────────────────────────────────
// Signal Plots + Background
// ──────────────────────────────────────────────
plot(TTMS_SignalsLongFinal ? 1 : 0, title='TTMS Long Signal', display=display.data_window)
plot(TTMS_SignalsShortFinal ? -1 : 0, title='TTMS Short Signal', display=display.data_window)
bgcolor(TTMS_SignalsLongFinal ? color.rgb(0, 230, 119, 75) : na)
bgcolor(TTMS_SignalsShortFinal ? color.rgb(255, 0, 89, 75) : na)
📄 Important Disclosures
📢 Disclaimer: This indicator and article are for informational and educational purposes only. Nothing herein constitutes a buy or sell recommendation. I may or may not be holding a position in the securities discussed.
🧑💼 Rajneesh Sharma is a SEBI-registered Research Analyst
Reg. No.: INH000020332
📄 Investments are subject to market risks. Read all related documents carefully before investing.
📩 Investor Charter & SCORES grievance redressal information is available on our blog.
Closing Thought
Markets don’t break out because of indicators.
They break out because volatility cycles.
TTM Squeeze Advance is simply a lens to observe when the market is silent…
and when it may be preparing to speak.