SML Mahindra Ltd. – Technical Analysis (Educational Purpose Only)
Stock: SML Mahindra Ltd.
Exchange: NSE
Timeframe: Daily (1D)
Analysis Date: 03 August 2026
Chart Overview
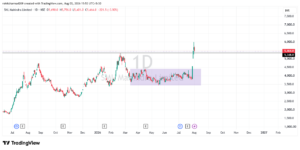
Based on the chart provided, SML Mahindra has witnessed a strong bullish breakout from a prolonged consolidation phase. The price moved sharply above the previous trading range, indicating increased buying interest. However, the latest candle shows rejection from higher levels, suggesting that market participants may be assessing whether the breakout can sustain.
Trend Analysis
- The stock remained in a sideways consolidation for several months between approximately ₹3,500 and ₹4,300.
- A decisive breakout above the consolidation range indicates a potential change in market structure.
- The recent rally has resulted in a higher high, which is generally considered a constructive technical development.
- The long upper wick on the latest candle indicates selling pressure at higher levels, making follow-through price action important.
Breakout Analysis
- The stock has moved above the previous resistance zone near ₹4,300.
- The breakout was accompanied by a sharp price expansion, reflecting increased momentum.
- Market participants may observe whether the stock sustains above the breakout zone over the coming sessions.
Support Levels
Immediate Support
₹5,350–₹5,400
- This level is currently acting as the nearest technical support.
Breakout Support Zone
₹4,250–₹4,350
- This represents the previous consolidation resistance.
- A sustained move above this area may strengthen the current technical structure.
Resistance Levels
Immediate Resistance
₹5,900–₹6,000
- The recent high indicates this as the nearest resistance zone.
Next Psychological Resistance
₹6,500
- If buying momentum continues, this level may become a technical observation point.